visual.spectrograph
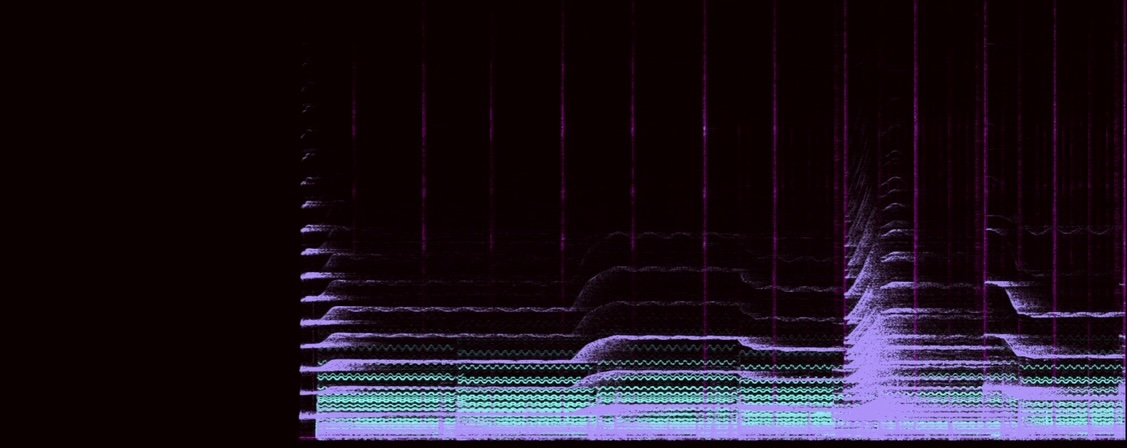
Can you guess the song?
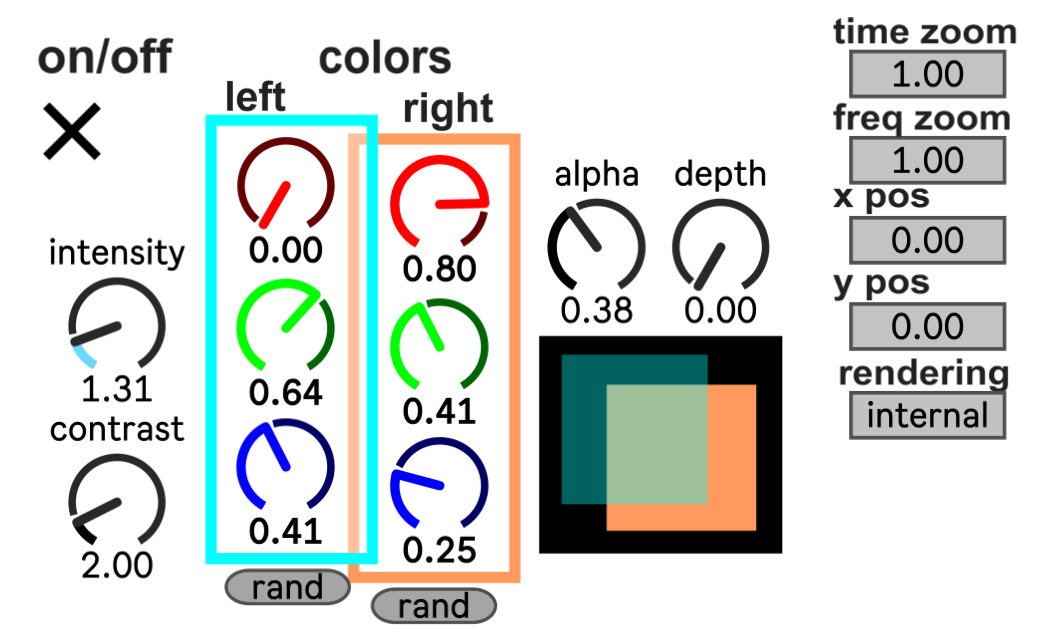
Stereo spectral visualizer with high resolution and flexible (and let's say a bit unusual) color mapping. It displays the frequency spectra of both left and right channels simultaneously in the same plot area. Subtle transparency between the channels, combined with contrasting or complementing colors, transforms the graph into dynamic patterns that intuitively highlight frequency differences between the two channels.
Download Max4Live (.amxd) here!
(or email me if you'd like to try a standalone version)
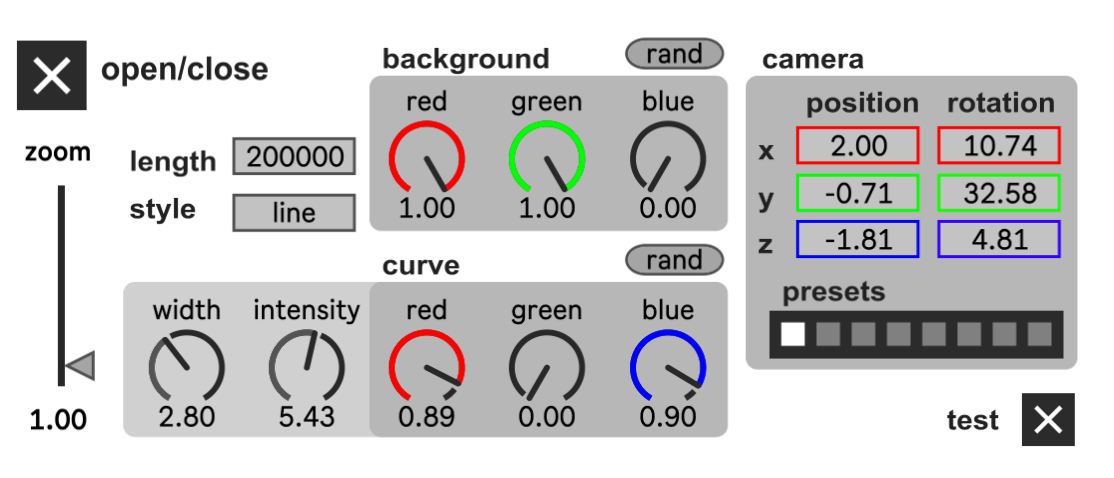
visual.XYT
A real-time visualization tool that extends the traditional XY oscilloscope into a third
dimension:
time. This allows for an intuitive observation of spatial sound characteristics emerging from
the
differences between the left and right channels (or, in fact, the phase of any two signals).
Try playing slightly detuned harmonics in each channel to reveal slowly evolving Lissajous
figures.
Observe the stereo imaging in high-quality acoustic recordings, or explore the spatial
characteristics of your favorite reverb/spatializer plugin. Experiment with frequency
modulation,
impulse-like envelopes, and resonators to uncover new sonic shapes.
Download Max4Live (.amxd) here!
(email me if you'd like to try a standalone version)
Currently working on: gradient color maps, multi-track operations, video export, automatic camera.
If you find my work useful or inspiring and would like to see more, consider contributing at buymeacoffee.com/wwronka. Feedback and ideas are just as valuable — feel free to write to contact@wwronka.com. Thanks!